The Geometry of Chinese Household Wealth: Medians, Upper Deciles, and the Liquidity Trap
Drawing on authoritative surveys from the PBOC, CHFS, Hurun, and UBS, this essay deconstructs the wealth pyramid of China's 494 million households. Behind the statistical illusion of property-driven net worth lies a profound structural divide: a national median of 500,000 RMB, an urban median of 1.2 million RMB, and a paralyzing liquidity freeze.

Executive Summary: Within digital echo chambers, the hyper-inflated myth that “an eight-figure net worth is ordinary and a million-yuan salary barely buys dignity” fuels perpetual status anxiety and cognitive dislocation. Cross-referencing balance-sheet surveys from the People’s Bank of China (PBOC), the China Household Finance Survey (CHFS) by SWUFE, the Hurun Wealth Report, the UBS Global Wealth Databook, and the World Inequality Database (WID), the empirical reality is far more sobering. China’s all-inclusive national median household net worth sits between 450,000 and 500,000 RMB ($63,000–$70,000), while the urban household median hovers between 1.1 million and 1.3 million RMB. A household net worth of 10 million RMB ($1.4M+) places a family securely in the top 0.5% of the country. This analysis deconstructs the six-tier wealth pyramid, maps the Pareto L-curve of distribution, and isolates the systemic mechanism behind why millions of asset-rich urbanites feel financially suffocated.
Figure 1: China’s macroeconomic wealth is heavily anchored in urban real estate, equity capital, and the state-dominated banking apparatus, yielding a rigid structural hierarchy (Source: Wikimedia Commons).
I. The Wealth Architecture: China’s Six-Tier Household Pyramid
Based on the Seventh National Population Census and updated demographic indicators from the National Bureau of Statistics, China encompasses approximately 494 million households (a population of ~1.41 billion with an average household size of 2.62 persons; permanent urban households account for 320 million to 350 million).
In financial economics, the only rigorous metric of substantive affluence is household net worth: the total sum of residential real estate, liquid financial holdings, and operating business assets, minus all residential mortgages, consumer credit, and private liabilities. Measured by this standard, China’s wealth distribution forms an exceptionally steep six-tier pyramid anchored by an expansive base:
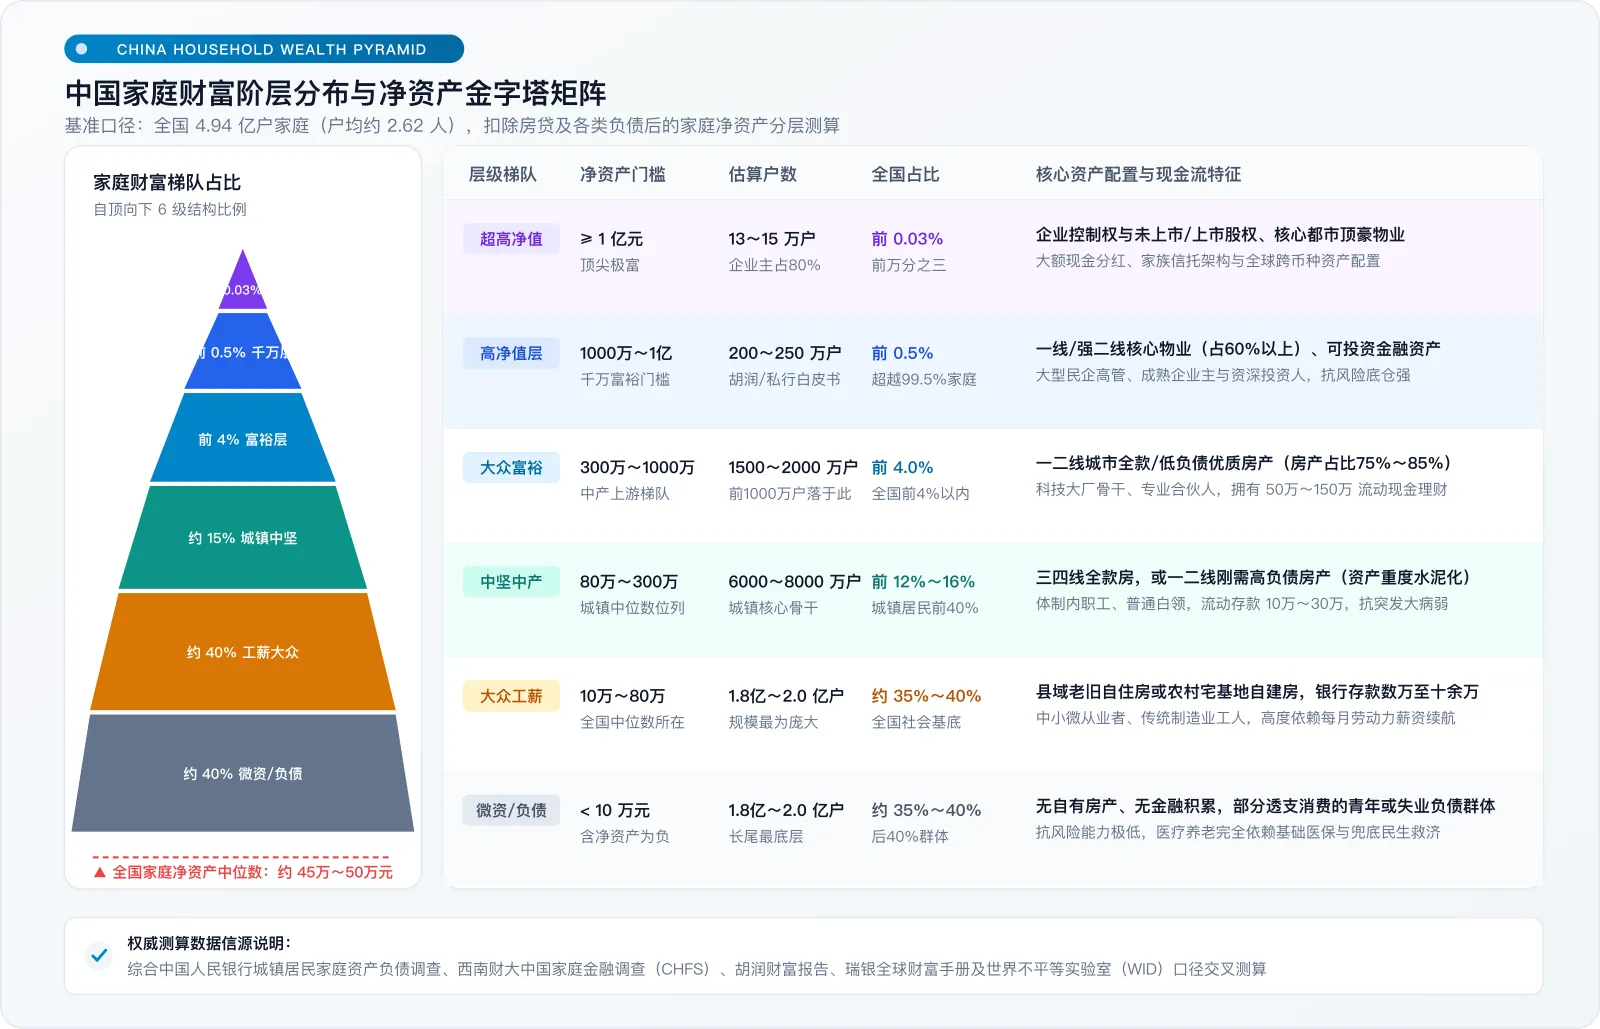
Figure 2: Stratification of Chinese household wealth by net asset tiers (Standard: national population, net of all liabilities).
| Wealth Tier | Household Net Worth Threshold | Estimated Household Count | National Share | Asset Allocation & Liquidity Profile |
|---|---|---|---|---|
| Ultra-High-Net-Worth (UHNW) | ≥ 100 Million RMB | ~130,000 – 150,000 | ~0.03% (Top 3 in 10,000) | Controlling enterprise equity (public/private), trophy properties in Tier-1 metros; institutional cash dividends, family trusts, and multi-currency global asset allocations. |
| High-Net-Worth (HNW) | 10M – 100 Million RMB | ~2.0M – 2.5 Million | Top 0.45% – 0.5% | Core real estate in Tier-1/strong Tier-2 cities (>60% of balance sheet), large certificates of deposit, structured financial products; senior executives, seasoned entrepreneurs, and professional investors. |
| Mass Affluent | 3M – 10 Million RMB | ~15M – 20 Million | ~3.5% – 4.0% | Fully owned or low-leverage primary residences in Tier-1/2 cities (75%–85% in real estate); mid-to-senior tech professionals, elite partners, holding 500,000 to 1.5 million RMB in liquid instruments. |
| Core Middle Class | 800,000 – 3 Million RMB | ~60M – 80 Million | ~12% – 16% | Debt-free homes in Tier-3/4 cities, or heavily leveraged starter homes in Tier-1/2 metros; civil servants, salaried white-collar workers, holding 100,000–300,000 RMB in cash reserves; highly vulnerable to health shocks. |
| Working Class | 100,000 – 800,000 RMB | ~180M – 200 Million | ~35% – 40% | Aging county-level housing or self-built rural dwellings; modest bank savings (tens of thousands of RMB); SME workers, traditional manufacturing labor; survival contingent on uninterrupted active labor. |
| Base Tier (Asset-Poor) | < 100,000 RMB | ~180M – 200 Million | ~35% – 40% | No property equity, negligible cash savings; includes indebted youth carrying negative equity and underemployed rural cohorts; zero risk buffer, dependent on basic state safety nets. |
This distribution reveals a stark structural truth: the 10-million-yuan benchmark, frequently dismissed on social platforms as the baseline for middle-class life, belongs exclusively to the top fraction of one percent. Meanwhile, the bottom two tiers—the working class and the asset-poor—comprise roughly 75% to 80% of all Chinese households.
II. What Is China’s True Median Household Wealth?
Assessing structural living standards requires relying on the median, not the arithmetic mean. Means are hopelessly skewed upward by the outsized balance sheets of billionaires. The median represents the exact midpoint: the household that divides the country into two equal halves.
To arrive at an accurate picture, we must distinguish between the all-inclusive national population and permanent urban households:
1. National Median Household Net Worth: ~450,000 to 500,000 RMB
- Scope: Covers all 494 million households, inclusive of rural villages, agricultural populations, and remote county towns.
- Empirical Basis: According to the UBS Global Wealth Databook, median wealth per Chinese adult is roughly $27,000 to $29,000 (approximately 190,000 to 210,000 RMB). Calibrated against the national average of 2.62 persons per household, the national median net worth settles firmly between 450,000 and 500,000 RMB ($63,000–$70,000).
- Sociological Reality: Any household with a debt-free net balance sheet of 500,000 RMB—such as a fully paid-off apartment in a fifth-tier county seat alongside modest bank deposits—has officially surpassed half of the families in China.
2. Urban Median Household Net Worth: ~1.1 Million to 1.3 Million RMB
- Scope: Covers roughly 320 million to 350 million households holding permanent residency in cities and established towns.
- Empirical Basis: The PBOC’s comprehensive Urban Household Balance Sheet Survey previously calculated an urban mean asset value of 3.18 million RMB, but an urban median net worth of only 1.41 million RMB. Factoring in price adjustments and equity corrections in real estate over recent years, the true urban median has stabilized between 1.1 million and 1.3 million RMB.
- Statistical Implication: The arithmetic mean (over 3 million RMB) is more than 2.5 times the median (1.2 million RMB). This massive divergence is textbook proof of extreme right-skewed wealth concentration.
III. The Top 10 Million Households: What Is the Entry Barrier?
Within an ocean of 494 million households, where does the threshold for the “Top 10 Million” actually sit?
- Percentile Position:
10,000,000 ÷ 494,000,000 ≈ 2.02%
- Distributional Status: The top 10 million households represent the top 2% of China’s wealth distribution.
- Threshold Net Worth: 5.0 million to 6.0 million RMB ($700,000–$840,000).
A household that holds over 5 million RMB in clear net worth—whether through a fully paid-off home in an urban core like Beijing, Shanghai, or Shenzhen, or a prime Tier-2 residence backed by liquid reserves—is inside the top 2% of the national socioeconomic hierarchy.
If evaluated purely by liquid investable financial assets (excluding primary residential real estate and counting only equities, mutual funds, cash, and deposits), the threshold for the top 10 million households drops to roughly 2.5 million to 3.0 million RMB.
IV. Where Does an Eight-Figure Net Worth (10 Million RMB) Truly Rank?
Digital algorithms routinely project an illusion of ubiquitous wealth, leading casual observers to assume that multi-million-yuan fortunes line every street corner in Tier-1 cities. Empirical data tells a radically different story of scarcity:
- Household Universe: According to data synthesized from the Hurun Wealth Report and private banking white papers, approximately 2.0 to 2.1 million households own 10 million RMB in gross assets. When accounting for debt and isolating true net worth of 10 million RMB, the pool shrinks to between 2.0 million and 2.5 million households.
- National Standing:
2,300,000 ÷ 494,000,000 ≈ 0.46%
Verdict: A net worth of 10 million RMB places a family comfortably within the top 0.5% of all Chinese households—ahead of 99.5% of the population.
- Urban Baseline Standing:
2,300,000 ÷ 340,000,000 ≈ 0.67%
Verdict: Even when excluding rural populations entirely and comparing only against urban peers, an eight-figure net worth remains within the top 0.7%.
In an average sample of 1,000 Chinese households, fewer than five attain this mark. This is almost never reached through conventional wage labor and disciplined budgeting. It is almost exclusively the product of early metropolitan land appreciation, private corporate equity, windfall equity-compensation events, or elite financial allocation.
V. Does the “Top 1% Owns 90%” Narrative Apply to China?
It is common for online commentators to borrow distorted variations of the Pareto principle, claiming that “the top 1% of Chinese households control 90% of the nation’s wealth.”
Empirically, this claim is demonstrably false.
Even across the world’s most financialized capitalist economies with acute inequality, an extreme concentration of 1% owning 90% has never materialized:
1. Comparative Macroeconomic Data
- The United States (The most stratified advanced economy):
Federal Reserve distributional financial accounts indicate that the top 1% of American households holds approximately 31% to 33% of total national wealth. The top 10% controls roughly 68% to 70%, while the bottom 50% commands a mere 2.5%. - China (PBOC, CHFS, and World Inequality Database data):
- Top 1%: Controls roughly 30% to 32% of total societal wealth (comparable to or slightly below the US).
- Top 10%: Holds approximately 64% to 67% of aggregate wealth.
- Middle 40%: Commands 26% to 28% of the wealth pool.
- Bottom 50%: Holds roughly 6% to 7% of national wealth.
2. Why “1% Owning 90%” Is Structurally Impossible in China
The structural firewall preventing this hyper-concentration is the fundamental composition of Chinese household assets compared to the West:
Structural Mechanism: Widespread Real Estate Ownership as a Wealth Anchor
Nearly 60% of total Chinese household wealth is locked in residential property. Urban homeownership stands at an astonishing 96.0%—and even within the lowest 20% income quintile in cities, homeownership exceeds 89%. In rural areas, the vast majority own self-built housing on homestead land. Hundreds of millions of regular families independently hold property assets valued from hundreds of thousands to a few million RMB. This distributed physical foundation aggregates to hundreds of trillions of RMB. Mathematically, it cannot be swallowed up by a 1% financial elite.
A “1% owning 90%” scenario can only occur in closed synthetic derivatives markets, unpegged crypto ecosystems, or abstract financial poker tables. In a continental economy anchored by land, massive personal savings, and distributed physical housing, that mathematical space does not exist.
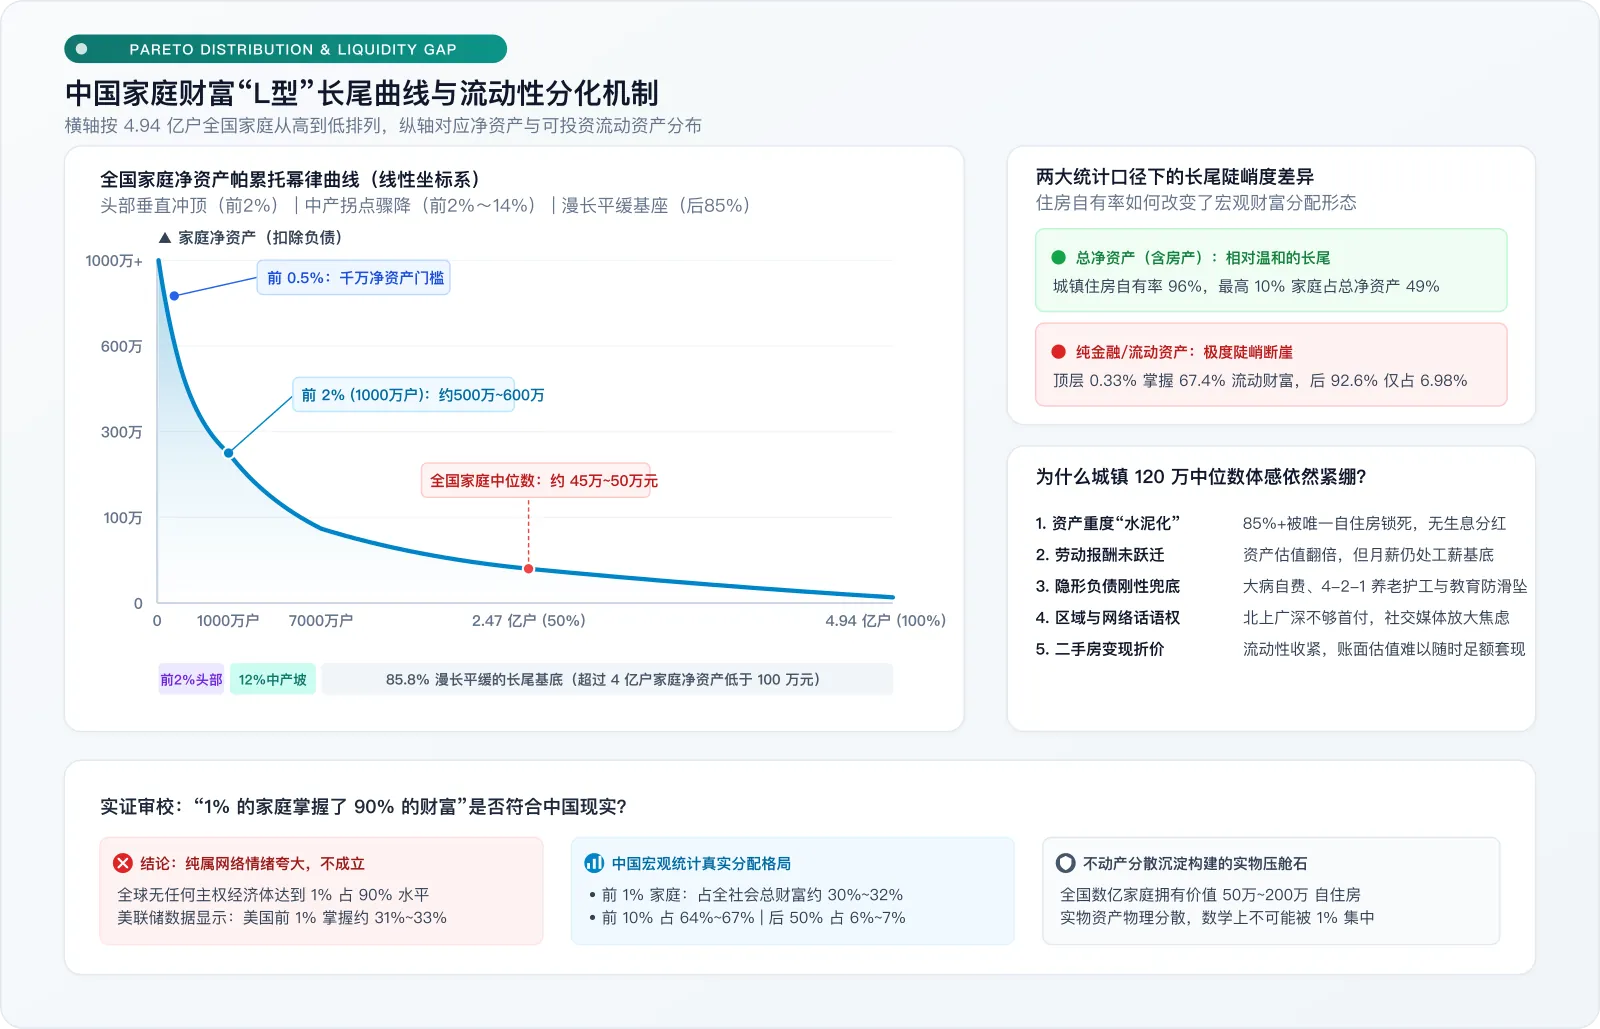
Figure 3: China’s household wealth Pareto L-curve and liquidity bifurcation (contrasting total net worth against the cliff-edge drop-off in pure financial assets).
VI. Why Urban Households at the 1.2M RMB Median Feel Chronically Strained
If a net worth of 1.2 million RMB puts an urban household right at the national urban midpoint—beating 50% of urban peers—why do these families universally report economic dread, vulnerability, and identify as “the working poor”?
This sharp disconnect between statistical positioning and psychological insecurity stems from five structural mechanics:
1. Concrete Illiquidity: The Non-Yielding Asset Trap
The primary driver of subjective poverty is asset composition: among urban households at the 1.2-million mark, 85% to 90% of their net worth is entombed in the concrete of their primary residence.
- Zero Yielding Cash Flow: A primary home is an essential consumption asset, not income-generating capital. It deposits zero cash or dividends into a bank account each month; rather, it demands ongoing maintenance fees, property outlays, utilities, and inevitable physical depreciation.
- Non-Monetizable Nature: A family cannot realistically liquidate their home to pay for daily life unless they accept displacement or downgrade their quality of living through perpetual rent payments.
- The Cash-Poor Trap: A typical three-person household with an unencumbered 1.2-million-yuan apartment often holds only 50,000 to 150,000 RMB in accessible liquid funds. Grocery runs, tuition fees, and medical copays are paid in hard cash, not nominal square meters.
2. Disconnected Velocities: Windfall Assets vs. Stagnant Wages
For most households, a seven-figure asset base was not accumulated through decades of disciplined labor savings; it was passively manufactured by two decades of aggressive hyper-urbanization and systemic real estate tailwinds.
- A couple holding a 1.2-million-yuan property might still earn a combined monthly wage of just 10,000 to 16,000 RMB.
- While the balance sheet reflects middle-class status, their active income has hit an operational ceiling. Daily survival still requires scanning for grocery coupons, waiting for seasonal e-commerce discounts, and delaying personal hardware upgrades. A life governed by a compressed monthly budget cannot generate psychological ease.
3. The Unfunded Mandate: Three Rigid Invisible Liabilities
In social-democratic welfare states like the Nordics, seven figures in liquid assets delivers deep psychological peace because healthcare, education, and pensions are fully socialized. Under China’s current safety net architecture, every ordinary balance sheet carries three non-negotiable off-balance-sheet liabilities:
- Critical Healthcare Costs: While public health insurance covers standard care, advanced oncology drugs, imported interventions, and long-term care routinely run into the hundreds of thousands of RMB—enough to vaporize a family’s liquid cash reserves overnight.
- The “4-2-1” Elder Care Burden: A single couple frequently confronts four aging parents. In major cities, professional caregiver services cost 6,000 to 9,000 RMB per month per parent, representing a massive, rigid financial risk.
- Defensive Education Outlays: To prevent intergenerational downward mobility in a fiercely competitive labor market, extracurricular and academic expenses are treated as strategic defenses that cannot be pruned.
These realities enforce a permanent siege mentality. That 100,000 RMB emergency deposit is not surplus capital; it is a life raft. Tapping it for lifestyle consumption triggers deep anxiety. This liquidity friction mirrors the dynamics explored in our analysis of FIRE Kill Line defense and liquidity buffer frameworks: absent reliable, self-replenishing cash flow, balance-sheet scale offers negligible real-world protection against sudden disruptions.
4. Spatial Disparity and Social Media Survivorship Bias
Wealth perception is relative, governed by social and geographic comparison:
- Spatial Fragmentation: A 1.2-million-yuan net worth is the urban median nationwide, but it is heavily concentrated in Tier-3/4 cities, interior towns, or the outer rings of major metros. In central Beijing, Shanghai, or Shenzhen, that sum cannot cover a 30% down payment on a modest apartment; it buys merely a few square meters of floor space.
- Digital Algorithmic Distortions: Dominant platforms (Xiaohongshu, Zhihu, Douyin) are dominated by Tier-1 professionals, finance elites, and asset-backed urbanites. Narratives insisting that “seven-figure incomes are standard” are continuously amplified. Confronted daily by these distorted reference points, median households experience acute relative deprivation.
5. Liquidity Freezes and Forced Valuation Haircuts
Following the broader correction across Chinese real estate, housing in lower-tier cities and non-prime metropolitan suburbs has run into structural illiquidity:
- An apartment nominally valued at 1.2 million RMB can sit on listing portals for months without a single inquiry. To monetize that property in an emergency, sellers are frequently forced to accept steep discounts—slashing prices by 30% to 40% to secure an exit.
- When families realize their core asset is both shrinking and impossible to convert quickly to cash, caution turns to outright retrenchment. Consumption contracts, and cash is hoarded. This mirrors the macro transmission mechanisms outlined in our study on LGFV debt resolution and household wealth preservation: structural balance-sheet shifts directly reset individual risk thresholds.
VII. Reading the Wealth Long-Tail: Two Parallel Worlds
Analyzing the Pareto L-curve of Chinese household wealth leads to an undeniable conclusion: the statistical lens you choose determines the economic reality you see.
- Under the “Total Net Worth (Including Real Estate)” Lens:
Because of China’s ~96% urban homeownership rate, the middle tier of society has a genuine physical asset base. The top 10% controls roughly 49% of all net assets, leaving 51% distributed across the remaining 90%. Across the middle percentiles, the distribution displays a relatively gradual, stabilizing slope. - Under the “Liquid Investable Financial Assets” Lens:
Once owner-occupied real estate is removed and the lens narrows to liquid, yield-bearing capital, the long-tail morphs into an absolute cliff. PBOC metrics indicate that the top 10% of households owns nearly 60% of all liquid financial assets. Deeper studies, including those by CICC, show that the top 0.33% of wealth holders commands almost two-thirds of investable assets, leaving the bottom 92.6% of the population to fight over less than 7% of liquid wealth.
This is the underlying paradox of modern urban life in China: on a balance-sheet basis, households rode two decades of historic property tailwinds into the upper tiers of global wealth; on a cash-flow basis, they remain pinned to the flat, exhausting bottom of the Pareto curve.
True resilience requires seeing past the paper valuation of illiquid assets. For the median household, escaping this structural squeeze requires restructuring the family balance sheet: transitioning away from dead concrete, building fortified cash-flow buffers, and systematically acquiring assets that produce tangible, resilient yields.
Related Research & Topics
Tello Mobile eSIM
SafetyWing Nomad Insurance
* Disclosure: This post contains affiliate links. If you make a purchase through these links, V-G Journal may earn a small commission at no additional cost to you. We only recommend services we independently evaluate and trust.
FIRE and Golf:自由旅居之路
专注于为追求 FIRE 与品质生活的人群提供特惠打球权益与候鸟微度假。不持一砖一瓦,运营品质生活。