Income Thresholds in China: Defining the Top 20% Across Three Metrics
This analysis dissects the true income thresholds for surpassing 80% of the Chinese population, using national statistics on disposable income, labor force earnings, and formal urban employment. It offers a grounded perspective against the distorted realities of social media and provides objective anchors for personal finance and FIRE planning.

Core Insights: In the echo chambers of social media algorithms and the information streams of high-tier urban circles, distorted perceptions like “earning less than 10,000 yuan a month means you’re at the bottom” or “earning a million yuan annually barely lifts you out of poverty” are pervasive. These anxieties, manufactured by algorithmic isolation and survivor bias, often detach individuals from their true macroeconomic context. By returning to official data from the National Bureau of Statistics’ household surveys, national tax filings, and urban employment figures, accurately defining “earning more than 80% of Chinese people annually” hinges on clarifying the statistical scope. Across three dimensions—national living standards, the entire labor force, and formal urban wage earners—the percentile thresholds reveal starkly different, yet critically real, societal income floors.

Figure 1: Official scene of the press conference on national economic performance by the State Council Information Office
I. National Population Scope: Per Capita Disposable Income (1.41 Billion People)
In international economics and official metrics from the National Bureau of Statistics, the most authoritative indicator of a nation’s prosperity is “National Per Capita Disposable Income.” This metric encompasses everyone, from newborns and students to the disabled and retirees. It is calculated as: the total net income of a household for the year, after deducting taxes and social security contributions, divided by the total permanent resident population of the household.
Each year, the National Bureau of Statistics divides the entire national population into five income quintiles (each group representing 20%, or approximately 280 million people) based on income levels. According to the latest official report on national resident income quintile groupings, the annual averages for each tier are as follows:
- Low-Income Group (Bottom 20%): Per capita disposable income of 9,542 yuan/year
- Lower-Middle Income Group (20%-40%): Per capita disposable income of 21,608 yuan/year
- Middle-Income Group (40%-60%): Per capita disposable income of 33,925 yuan/year
- Upper-Middle Income Group (60%-80%): Per capita disposable income of 53,359 yuan/year
- High-Income Group (Top 20%, i.e., 80th-100th percentile): Per capita disposable income of 98,809 yuan/year
【Threshold for Exceeding 80% of the Population (P80 Level) - National Scope】
- Individual Per Capita Standard: At the cusp between the “Upper-Middle Income Group” and the “High-Income Group,” national per capita disposable income reaches 68,000-75,000 yuan/year (equivalent to approximately 5,700-6,250 yuan/person/month), placing one in the top 20% of living standards nationwide.
- Typical Family Calculation: For a standard three-person household (two parents and one child), the family’s total annual net income after tax needs to reach 200,000-225,000 yuan for the per capita income to rank in the top 20% nationally.
Many are surprised by this figure because they overlook the averaging effect: if one family member is not working or if the family supports two elderly parents without pensions, the income of the working members is quickly diluted. This metric reflects the actual resilience and living standard of the household as a whole.
II. Labor Force Scope: Actual Personal Labor Income (Approx. 740 Million Employed Individuals)
If we exclude the elderly and minors who are not part of the market economy, and instead compare individuals who are capable of working and are actively generating income (including those in public institutions, private enterprises, delivery riders, truck drivers, self-employed individuals, construction workers, migrant workers, and flexible employment personnel, totaling approximately 740 million people):
1. The Hard Reality of National Income Tax Data
China’s personal income tax threshold for comprehensive income is 60,000 yuan/year (or 5,000 yuan/month). After deducting the statutory “five social insurances and one housing fund” (basic pension, medical, unemployment insurance, and housing provident fund) and six special additional deductions for children’s education, elderly care, first-home mortgage interest, or housing rent, in practical terms, an ordinary wage earner earning 8,000-10,000 yuan per month often has a taxable income close to zero.
Fiscal and tax data confirm this: the total number of workers actually paying personal income tax nationwide consistently remains between 65 million and 70 million. This implies that out of the 740 million working population nationwide, only about 9% have crossed the tax-paying threshold.
2. Laborer Percentile Calculation
To surpass 80% of the actual labor force means one’s personal income-generating ability must rank within the top 20% of all 740 million working individuals (i.e., within the top 148 million).
【Threshold for Exceeding 80% of the Labor Force】
- Personal net income after tax (including basic salary, bonuses, net operating profit, etc.) reaching 80,000-100,000 yuan/year (equivalent to a net monthly income after tax of approximately 6,700-8,300 yuan), would firmly place one above 80% of income-earning workers nationwide.
- If personal net annual income after tax exceeds 100,000 yuan, within the total labor force of 740 million, one has solidly entered the top 10%-15% income bracket.
III. Formal Urban Enterprise and Institution Wage Earner Scope (Approx. 180 Million People)
Many white-collar workers in high-tier city office buildings experience “involution” and peer pressure not from the entire 1.4 billion population, nor from the 740 million broad labor force, but are confined to the highly narrow circle of “formal urban enterprise and institution wage earners” (approximately 180 million people).
This group comprises two main segments:
- Employees in Urban Non-Private Sector Units: Including government agencies, public institutions, state-owned enterprises, foreign-funded enterprises, financial institutions, and large listed companies, with an average annual salary of about 120,000 yuan.
- Employees in Urban Private Sector Units: Registered employees of formal private enterprises in urban areas, with an average annual salary of about 68,000 yuan.
In modern statistics, salary distribution exhibits a typical “extreme right-skewed characteristic”: the high salaries of a very small number of executives, core technical staff, and financial professionals significantly inflate the arithmetic mean of the entire group, causing the median income to be substantially lower than the average.
【Threshold for Exceeding 80% of Formal Urban Wage Earners】
- A personal comprehensive annual salary before tax (including year-end bonuses, and employer/employee contributions to social insurance and housing fund) needs to reach 130,000-150,000 yuan (equivalent to a monthly salary before tax of approximately 11,000-12,500 yuan) to rank in the top 20% (top 36 million) within this group.
- This also explains why in the context of formal employment, “a monthly salary exceeding 10,000 yuan before tax” is widely considered a watershed: even within the most elite 180 million public sector and large/medium enterprise wage earners, those earning over 10,000 yuan monthly before tax are still a minority (around the top 20%).
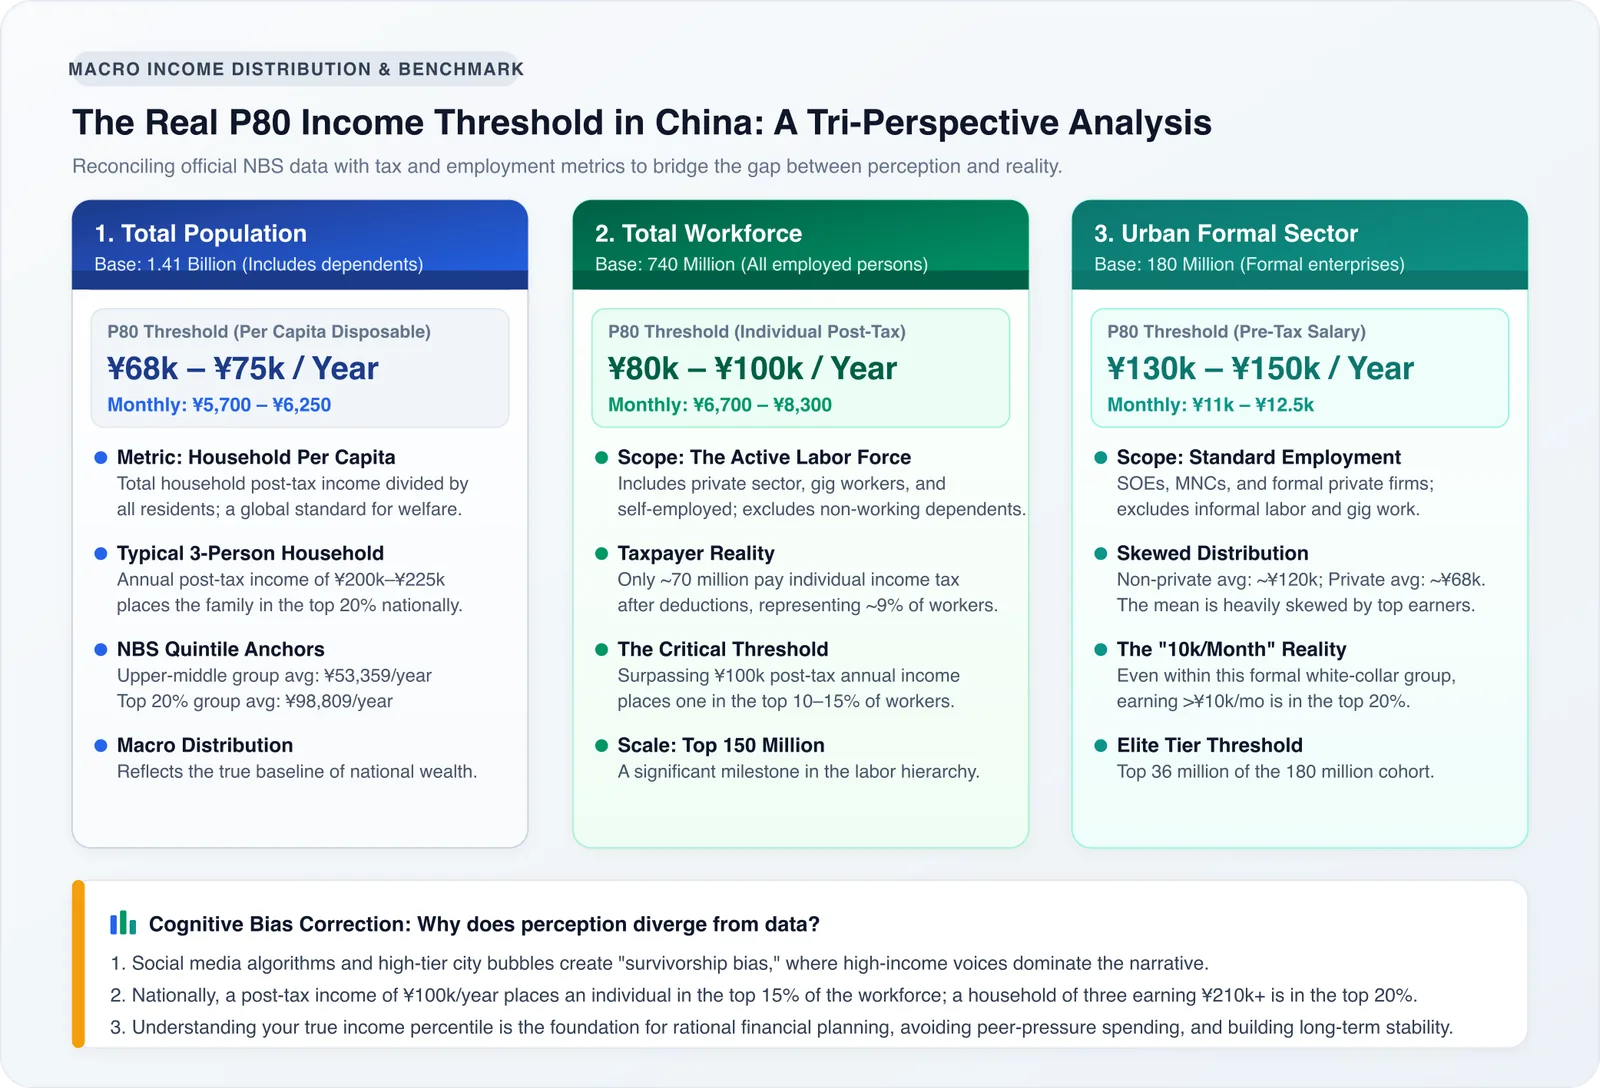
Figure 2: Precision Matrix of Annual Income Percentile Thresholds Exceeding 80% of Chinese People Across Three Statistical Scopes
IV. Comparison of the Three Scopes and Core Conclusion Matrix
By consolidating and comparing the statistical scopes from the above three dimensions, the true social income percentile coordinates can be clearly visualized:
| Statistical Comparison Dimension | Covered Base Scale | Metric Used | Annual Income Required to Exceed 80% of This Group | Equivalent Monthly Benchmark |
|---|---|---|---|---|
| National Population Scope | 1.41 Billion People (incl. non-labor force) | Per Capita Disposable Income | 68,000-75,000 yuan/year (Approx. 210,000 yuan/year net for a 3-person household) | Approx. 5,700-6,250 yuan/person/month |
| Labor Force Scope | Approx. 740 Million Employed Individuals | Personal Net Labor Income After Tax | 80,000-100,000 yuan/year | Approx. 6,700-8,300 yuan/month net |
| Formal Urban Wage Earner Scope | Approx. 180 Million Registered White-Collar/Employees | Comprehensive Annual Salary Before Tax | 130,000-150,000 yuan/year | Approx. 11,000-12,500 yuan/month before tax |
V. Correcting Macroeconomic Perceptions and Personal Financial Security Principles
After clarifying the true macroeconomic data, three key perceptual shifts are crucial for influencing individual financial decisions and quality of life:
1. Penetrating the “Survivor Bias” Created by Algorithms
Social media recommendation algorithms have a strong inherent bias: content showcasing wealth, high salaries, luxury cars, and lavish lifestyles often garnishes the highest exposure and engagement. Ordinary people, comprising over 80% of the population and living everyday lives focused on necessities, are virtually “voiceless” in the public online space. This skewed attention creates an extremely distorted illusion, leading individuals in first-tier cities to mistakenly believe that “earning 20,000 yuan a month is just the passing grade.” Understanding the macroeconomic fundamentals is the first psychological defense against baseless peer anxiety.
2. Shifting from Blind Pursuit of Gross Salary to “Retained Net Cash Flow”
During periods of macroeconomic adjustment, nominal salary levels often mask high sunk costs. A white-collar worker in a first-tier city earning 300,000 yuan annually before tax, after deducting personal income tax, high rent/mortgage payments, commuting expenses, premium dining, and implicit costs of maintaining professional appearance, may find their actual retained free cash flow at year-end is less than the net savings capacity of someone earning 120,000 yuan annually in a lower-tier city or as a digital nomad.
As repeatedly emphasized in our analyses of workplace depreciation and balance sheets: true financial security never lies in which percentile your nominal income falls, but rather in whether your asset side possesses sustainable passive cash flow and whether your liability side is sufficiently lean.
3. Constructing a Rational FIRE Plan Tailored to Your Circumstances
For practitioners pursuing early retirement or a global digital nomad lifestyle, understanding macroeconomic income distribution offers clear anchoring value: If you have already achieved a personal net income after tax exceeding 100,000 yuan/year, or if your household’s net income after tax reaches over 200,000 yuan, you already possess income-generating and capital accumulation capabilities that surpass 80% of the population on a macroeconomic level. At this juncture, the most critical task is no longer to take on excessive leverage in pursuit of illusory “get-rich-quick” myths, but rather to allocate existing assets into inflation-resistant, low-volatility hard assets and cash-flow-generating investments. Through simplified living and cost audits, you can sooner secure your personal autonomy.
Related Research & Topics
Tello Mobile eSIM
SafetyWing Nomad Insurance
* Disclosure: This post contains affiliate links. If you make a purchase through these links, V-G Journal may earn a small commission at no additional cost to you. We only recommend services we independently evaluate and trust.
FIRE and Golf:自由旅居之路
专注于为追求 FIRE 与品质生活的人群提供特惠打球权益与候鸟微度假。不持一砖一瓦,运营品质生活。