Amazon's AI CapEx vs. Airline Deficits: The 220G Compute Gamble and the Asset-Heavy Trap
Examining the stark divergence in capital efficiency: Amazon generated record Q3 operating profits of $28.1B while driving AWS up 39.3%, yet saw its stock drop over $220B in AI infrastructure spending, while China's top three airlines logged $405.24B in revenue yet sank into an $8.43B loss. Both are heavy asset models, but one commands pricing power via $578B in backlog contracts while the other remains chained to jet fuel, dollar-denominated debt, and high-speed rail displacement.


Figure 1: Streetscape of Amazon’s Seattle headquarters (The Spheres)—during the late October 2026 earnings season, Amazon aggressively poured $220 billion in cash CapEx into AI compute infrastructure, while traditional aviation assets remained bogged down in a zero-sum mud pit of locked marginal costs.
The late October 2026 earnings season delivered a brutal, simultaneous audit of two heavy-asset business models across the Pacific. Amazon posted a record $28.1 billion in third-quarter operating profit, fueled by a 39.3% surge in AWS. Yet, its shares slumped after its $220 billion annualized compute capital expenditure dragged its trailing-twelve-month (TTM) free cash flow down into a $42.4 billion deficit. Meanwhile, in China’s domestic aviation market, Air China, China Eastern, and China Southern racked up a combined RMB 405.24 billion ($57B+) in revenue during the first three quarters, only to record a staggering net loss of RMB 8.43 billion—effectively bleeding roughly RMB 22.70 on every single passenger carried. Despite both relying on high-intensity capital consumption, compute infrastructure and commercial aviation are hurtling toward fundamentally opposite destinies in pricing power and cash flow conversion.
I. Wall Street’s Cash Flow Shock: Why a $28.1B Operating Profit Couldn’t Mask a -$42.4B Free Cash Flow Deficit
A close inspection of Amazon’s Q3 2026 earnings report (released October 29, 2026, for the period ending September 30) reveals a severe tension between its income statement and its cash flow statement.
From an operational standpoint, the Seattle tech titan delivered an undeniable display of dominance. Total net sales climbed 12% year-over-year (13% ex-FX) to $201.9 billion, up from $180.2 billion in Q3 2025, landing just shy of Wall Street consensus expectations of $202.2 billion. More impressively, profitability surged: consolidated operating income jumped 61% year-over-year to $28.1 billion (compared to $17.4 billion in Q3 2025), expanding the operating margin from 11.4% to a record 13.9%. Although net income dipped roughly 2% to $20.69 billion ($1.89 diluted EPS, missing the $1.97 consensus, largely due to Q3 2025 including a $9.5 billion pre-tax valuation gain on its Anthropic investment), high-margin segments hummed along. Advertising services grew 11%–12% to $19.6 billion, and subscription services climbed to $14.0 billion.
The undisputed engine remained Amazon Web Services (AWS). In Q3 2026, AWS net sales accelerated by 39.3% year-over-year to $46.0 billion ($45.98 billion exact, up from $33.01 billion in Q3 2025), pushing its annualized run rate to $184 billion. This marks the sixth consecutive quarter of accelerating growth for AWS, hitting its fastest pace in five years. On the profit side, AWS generated $17.8 billion in operating income (up 55%–56% from $11.4 billion in Q3 2025), expanding its operating margin from 34.6% to 38.7%. Generating less than a quarter of the corporation’s total revenue, AWS delivered roughly 63% of its total operating profit.
Yet the secondary market’s reaction was ice cold. Amazon shares dropped 4.25% to close at $243.79 on October 29, followed by another 7.07% rout in pre-market trading to $226.55. Mainstream commentary occasionally misdiagnosed this as “faltering AI investments” or “peaking cloud demand.” However, drilling down into the cash flow statement reveals the true fuse that triggered Wall Street’s quantitative models: a monstrous capital expenditure bill.
To build out AI data centers, deploy proprietary silicon (Trainium and Graviton), and secure supporting power infrastructure, Amazon’s cash outlays for property and equipment in Q3 2026 skyrocketed 120% year-over-year to $77.3 billion (up from $35.1 billion in Q3 2025). Over the trailing twelve months (TTM), total property and equipment acquisitions surged to $215.2 billion—a 79% jump from the previous year’s $120.1 billion—with management reiterating its full-year 2026 cash CapEx guidance of approximately $220 billion.
This unprecedented sprint into compute infrastructure directly breached the company’s free cash flow defenses. Despite a 29% year-over-year increase in TTM operating cash flow to $168.3 billion, subtracting these massive capital outlays flipped Amazon’s TTM free cash flow from a positive $14.8 billion a year ago into a net outflow of $42.4 billion—a net reversal of roughly $57 billion. Wall Street’s sell-off was fundamentally a discount-rate reassessment of when this -$42.4 billion deficit would hit an inflection point of depreciation and return, not a vote of no confidence in top-line growth.
II. Four Hundred Billion in Revenue, Eight Billion in Red Ink: Dissecting the “Fly-More-Lose-More” Airline P&L
During the exact same week Wall Street bickered over Amazon’s $220 billion compute bill, mainland China released Q3 2026 reports for Air China (601111.SH), China Eastern (600115.SH), and China Southern (600029.SH). Countering simplistic media narratives of “consumers staying home and avoiding flights,” these three major carriers faced a classic structural paradox: high revenues, high passenger volumes, and deep losses.
For the first three quarters of 2026 (January–September), all three state-owned aviation giants posted positive top-line growth, pulling in a combined RMB 4052.41 billion ($57B+) in operating revenue. Yet, once this massive river of cash filtered through the income statements, the consolidated net loss attributable to parent shareholders hit RMB 8.43 billion. Factoring in total passenger volume over the nine months, the carriers effectively subsidized every single traveler to the tune of RMB 22.70 out of pocket.
Even more alarming was the single-quarter performance. The third-quarter summer travel season is historically the most lucrative profit window for the civil aviation industry. Yet in Q3 2026, the seasonal money-making machine largely misfired:
- Air China: Generated RMB 1409.63 billion in revenue for the first three quarters (+8.58% YoY), with a net loss of RMB 2.015 billion and a core non-GAAP net loss of RMB 2.724 billion. In Q3, despite revenue ticking up 5.35% to RMB 51.695 billion, net profit plummeted 92.64% year-over-year to a paltry RMB 271 million, with core non-GAAP profit shrinking to roughly RMB 62.7 million (-98.28% YoY).
- China Eastern: Posted RMB 1170.66 billion in revenue for the first three quarters (+10.01% YoY), with a net loss of RMB 2.115 billion and a core non-GAAP loss of RMB 3.256 billion. Q3 revenue grew 8.18% to RMB 42.832 billion, but net profit shriveled to RMB 64 million—a 98.19% plunge. Excluding non-recurring items, its Q3 core operations actually ran at a net loss of roughly RMB 59 million (-101.86% YoY).
- China Southern: As the carrier with the largest fleet, it logged RMB 1472.12 billion in revenue (+6.93% YoY) for the first three quarters, but suffered a staggering net loss of RMB 4.305 billion and a core non-GAAP loss of RMB 5.59 billion—the deepest deficit among the Big Three. Even during the peak summer rush, Q3 revenue inched up just 2.26% to RMB 52.533 billion, while posting a net loss of RMB 609 million and a core operating loss of RMB 880 million, making it the only major carrier to slide into an outright net loss during the peak summer quarter.
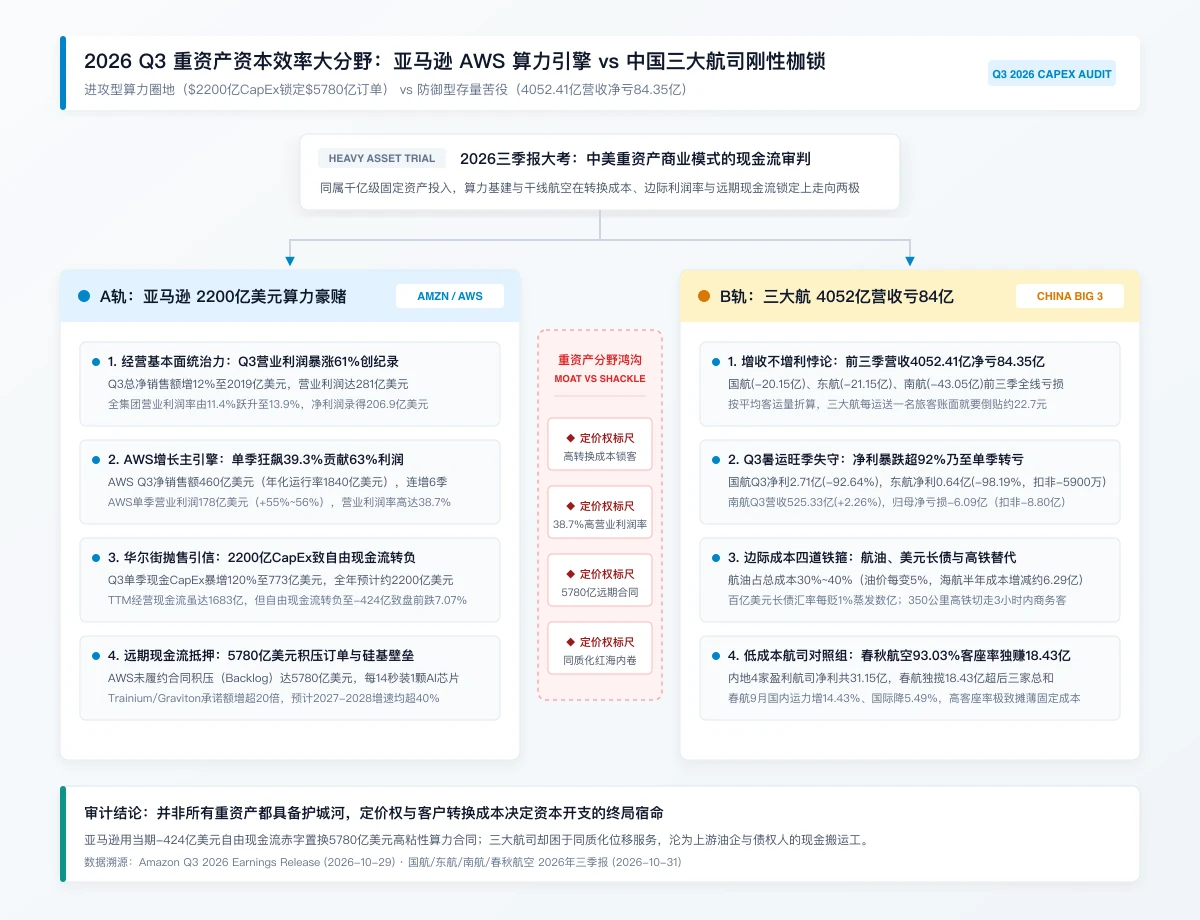
Figure 2: The Dual-Track Divergence of Heavy-Asset Models—Amazon AWS trades high-frontloaded CapEx for a 38.7% operating margin and $578 billion in contract backlogs, whereas legacy airlines remain trapped in a negative feedback loop of rigid costs and eroding pricing power.
Laying out Amazon and mainland China’s legacy airlines on the same financial audit table highlights a stark gulf in capital efficiency:
| Entity | Core Q3 2026 Revenue Metrics (YoY Growth) | Profitability & Margins (Q3 / YTD) | CapEx / Fleet & Balance Sheet Profile | Business Model Characterization |
|---|---|---|---|---|
| Amazon Group (AMZN) | Q3 Net Sales $201.9B (+12%) | Q3 Operating Income $28.1B (+61%), Operating Margin 13.9%; Net Income $20.69B | Q3 Cash CapEx $77.3B (+120%), Full-Year Est. $220B; TTM Free Cash Flow -$42.4B | Tech Heavy-Asset Infrastructure Phase (Strong operating cash flow funding frontloaded expansion) |
| Amazon AWS Cloud | Q3 Net Sales $46.0B (+39.3%), Annualized Run Rate $184B | Q3 Operating Income $17.8B (+55%–56%), Operating Margin 38.7% | Unperformed Contract Backlog hits $578B; Installs an AI accelerator every 14 seconds | Offensive Compute Land-Grab (High pricing power, high switching costs) |
| Air China (601111.SH) | YTD Revenue RMB 140.96B (+8.58%); Q3 RMB 51.70B (+5.35%) | YTD Net Loss RMB 2.02B; Q3 Net Profit RMB 271M (-92.64%) | Sept. international capacity up 14.2%; squeezed by jet fuel, USD long-term debt, and short-haul rail diversion | Traditional Trunk-Line Aviation (Seasonal profits heavily diluted) |
| China Eastern (600115.SH) | YTD Revenue RMB 117.07B (+10.01%); Q3 RMB 42.83B (+8.18%) | YTD Net Loss RMB 2.12B; Q3 Net Profit RMB 64M (-98.19%), Core Non-GAAP -RMB 59M | Sept. international capacity up 13.77%; passenger traffic growth lagged capacity deployment, seat loads slipped | Traditional Trunk-Line Aviation (Core operations unprofitable in peak season) |
| China Southern (600029.SH) | YTD Revenue RMB 147.21B (+6.93%); Q3 RMB 52.53B (+2.26%) | YTD Net Loss RMB 4.31B; Q3 Net Loss -RMB 609M | Sept. international capacity up 8.37%; widest-body fleets and long-haul fixed depreciation/fuel burdens heaviest | Traditional Trunk-Line Aviation (Single-quarter net losses during peak season) |
| Spring Airlines | Focused on domestic high-density price-sensitive routes | YTD Net Profit RMB 1.84B (-21.08%), remaining mainland China’s most profitable airline | Sept. domestic capacity up 14.43%, international down 5.49%, seat load anchored at a stellar 93.03% | Ultra-Low-Cost Carrier (Single aircraft family, high load factors) |
III. The Four Iron Shackles Locking Down Marginal Costs: Jet Fuel, USD Debt, the 3-Hour HSR Circle, and Spring Airlines’ Contrast
Why do the Big Three airlines fail to escape the loss-making mire of “losing RMB 22.70 per passenger” despite pulling in over RMB 405.24 billion in revenue? Drilling down into aviation cost accounting reveals four rigid iron shackles locking down the Cost per Available Seat Kilometer (CASK) for full-service legacy carriers.
The first shackle is elevated jet fuel costs. Jet fuel consistently consumes 30% to 40% of an airline’s total operating expenses. Prolonged Middle East geopolitical conflicts kept international crude and jet fuel prices hovering at elevated ranges throughout 2026, directly eroding ticket gross margins. Taking Hainan Airlines’ sensitivity modeling as an example, for every 5% swing in jet fuel prices, the carrier’s semi-annual operating costs expand or contract by roughly RMB 629 million. When upstream energy prices remain stubbornly high while downstream ticket prices fail to keep pace due to consumer belt-tightening and intense fare wars, airlines effectively function as unpaid cash couriers for energy giants.
The first shackle is compounded by US dollar leasing debt and FX losses in a high-interest-rate environment. Aviation is intensely reliant on dollar-denominated debt and cross-border financing leases to acquire fleets. In a global high-rate climate, interest expenses on operating leases flow straight into period financial expenses, jacking up fixed costs. Simultaneously, for every $10 billion in long-term debt carried, a 1% depreciation of the RMB against the USD instantly vaporizes hundreds of millions of yuan in non-operating gains from the books.
The third shackle is the physical displacement of golden business routes by 350 km/h high-speed rail (HSR) networks. Over the past two decades, short-haul, high-frequency corporate routes like Beijing-Shanghai, Shanghai-Guangzhou, and Chengdu-Chongqing served as the most lucrative cash cows for the Big Three. However, with dense networks of 350 km/h “Fuxing” bullet trains coming online, 4-to-8-hour ground journeys across East, Central, and South China have been compressed to under three hours. HSR’s advantages in punctuality, downtown accessibility, and fare stability permanently siphon off time-sensitive short-haul business travelers. Deprived of short-haul high-margin routes, the Big Three were forced to dump wide-body aircraft and excess capacity into high-elasticity medium-long haul or international routes—in September 2026, international capacities for Air China, China Eastern, and China Southern rose 14.2%, 13.77%, and 8.37% respectively. Yet China Eastern and China Southern saw passenger traffic growth lag behind capacity deployment, pressing down load factors. This supply-side structural mismatch mirrors the balance sheet repair dilemmas witnessed across traditional manufacturing cash flows and capacity clearouts.
The fourth shackle is the public service mandate and administrative rigidity of state-backed flag carriers. Unlike private commercial entities driven purely by profit maximization, state-owned airlines bear the public duty of maintaining connectivity across national trunk and branch networks. They must keep routine flights running even on chronically unprofitable routes serving remote western regions or strategic international paths. Bound by the institutional frameworks of state-owned enterprise mixed-ownership walls and fundamental performance audits, this structural network rigidity, coupled with massive fleet maintenance and labor overhead, leaves the Big Three virtually powerless to swiftly prune fixed costs during industry headwinds.
The most persuasive control group comes from private low-cost carriers. In the first three quarters of 2026, the combined net profits of the mainland’s only four profitable airlines slumped by half to roughly RMB 3.115 billion: Spring Airlines defended its crown as mainland China’s most profitable airline with RMB 1.843 billion in net profit (-21.08% YoY); Hainan Holding ranked second with RMB 820 million (-71.18% YoY); Juneyao Airlines and Huaxia Airlines posted RMB 327 million (-69.94% YoY) and RMB 125 million (-79.78% YoY) respectively. The combined profits of the latter three (roughly RMB 1.273 billion) fell short of Spring Airlines alone.
Spring Airlines’ ability to harvest RMB 1.843 billion in net profit amid an industry-wide winter stems from its ruthless optimization of capacity allocation and unit costs: in September 2026, Spring and Juneyao decisively cut back on pressured international routes (international capacity down 5.49% and 1.24% YoY), driving domestic capacity up 14.43% and 15.36%, thereby anchoring seat load factors at stellar highs of 93.03% and 87.65%. By relying on a single narrow-body family to suppress maintenance costs, stripping out free meals and checked luggage allowances, and precisely harvesting price-sensitive leisure travelers, Spring proved that surviving a zero-growth market requires shrinking marginal costs to the absolute bone to defend positive cash flow.
IV. Offensive Compute Land-Grab vs. Defensive Stockpile Servitude: The Ultimate Divide in Heavy-Asset Pricing Power
Why did Wall Street analysts maintain a lofty average target price of $332.41 (leaving massive upside from the $226.55 pre-market price) even after Amazon’s 7.07% pre-market plunge, while traditional aviation assets languish in low-valuation mud pits, despite both piling hundreds of billions of dollars of fixed assets onto the left side of their balance sheets?
The answer lies in the “moat switching costs” and “forward contract locking capability” forged by capital expenditures.
Amazon CEO Andy Jassy disclosed a visually striking engineering metric during the earnings call: AWS data centers are currently installing and lighting up an AI accelerator every 14 seconds. Customer commitments for its proprietary chips (Graviton and Trainium) surged over 20-fold year-over-year, and higher-certainty commercial AI inference workloads now account for half of total AWS AI revenue. This process of pouring physical silicon barriers into the real world at a rate of one chip every 14 seconds corroborates the evolution of hard physical defenses in the compute era. What determines the final victor among tech giants is no longer light-asset traffic tricks, but the scalable delivery capacity of heavy-asset power infrastructure, data center cabinets, and custom silicon.
More importantly, Amazon’s $220 billion CapEx gamble is not a blind roll of the dice; it is backed by a staggering $578 billion in AWS unperformed contract backlogs (up triple digits year-over-year) acting as forward cash flow collateral. Once global enterprise clients migrate core business systems, proprietary data lakes, and AI inference workflows onto AWS’s Trainium chip architecture, sky-high migration costs automatically morph into long-term pricing power (manifested in AWS’s 38.7% operating margin). Backed by this deep backlog, Amazon guided Q4 2026 net sales to $240B–$247B (12%–16% YoY growth) and operating income to $28.5B–$33.5B (up from $25.0B in Q4 2025). Jassy further projected that AWS revenue growth will eclipse 40% in both 2027 and 2028, growing into a trillion-dollar-plus business over the next five to ten years.
Conversely, in traditional full-service commercial aviation, a Boeing or Airbus aircraft delivers highly commoditized physical transport regardless of who flies it. Passengers swipe booking apps and switch carriers without hesitation over a few dozen yuan difference. Costs are locked upstream by jet fuel (30%–40% of expenses) and aircraft manufacturing oligopolies, weighed down midstream by high-interest dollar debt, and ambushed downstream by 350 km/h high-speed rail alongside peer price wars. In a sector devoid of product differentiation and customer lock-in mechanisms, heavy-asset deployment doesn’t build an exclusionary moat; it morphs into a crushing shackle of depreciation and interest expenses.
These two Q3 earnings reports from late October 2026 offer business observers and investors a textbook asset audit: not all heavy-assets deserve long-term valuation premiums. Trading a current -$42.4 billion free cash flow deficit to secure $578 billion in high-sticky compute contracts and a 38.7% operating margin is an offensive compute land-grab backed by pricing power. Conversely, racking up massive aircraft lease liabilities in a commoditized red ocean to generate RMB 405.24 billion in revenue while losing RMB 8.43 billion is defensive stockpile servitude stripped of pricing power. Under the iron law of capital returns, heavy-asset expansion without a moat is nothing more than bookkeeping pageantry working for upstream suppliers and creditors.
Related Research & Topics
Tello Mobile eSIM
SafetyWing Nomad Insurance
* Disclosure: This post contains affiliate links. If you make a purchase through these links, V-G Journal may earn a small commission at no additional cost to you. We only recommend services we independently evaluate and trust.
FIRE and Golf:自由旅居之路
专注于为追求 FIRE 与品质生活的人群提供特惠打球权益与候鸟微度假。不持一砖一瓦,运营品质生活。