The T8 Fallacy: Atmospheric Dynamics and the Super El Niño Engine
The 'Pacific T8 Hurricane' is not an official meteorological rank, but a cognitive collision between Dvorak T8.0 theoretical peaks and Hong Kong’s T8 warning signals. We deconstruct the climate dynamics of Super El Niño, where West Pacific typhoon counts drop while individual ferocity reaches terminal extremes.

Executive Summary: Whenever a superstorm brews in the Pacific, the term “T8 Hurricane” resurfaces in social media and non-professional news cycles, fueling panic through misinformation. In the official nomenclature of the World Meteorological Organization (WMO) and national agencies, a “T8 Hurricane” does not exist. This phrasing is a linguistic chimera, grafting the theoretical peak of satellite intensity analysis (Dvorak T8.0) onto local civil defense signals (Hong Kong’s Signal No. 8). When the global climate encounters a “Super El Niño,” the evolution of tropical cyclones does not manifest as a simple record-breaking surge in numbers. Instead, it creates a complex spatial bifurcation: suppressed frequency in the Northwest Pacific, a surge in the East Pacific, and the late-autumn birth of long-lived “terminal kings” of atmospheric pressure.
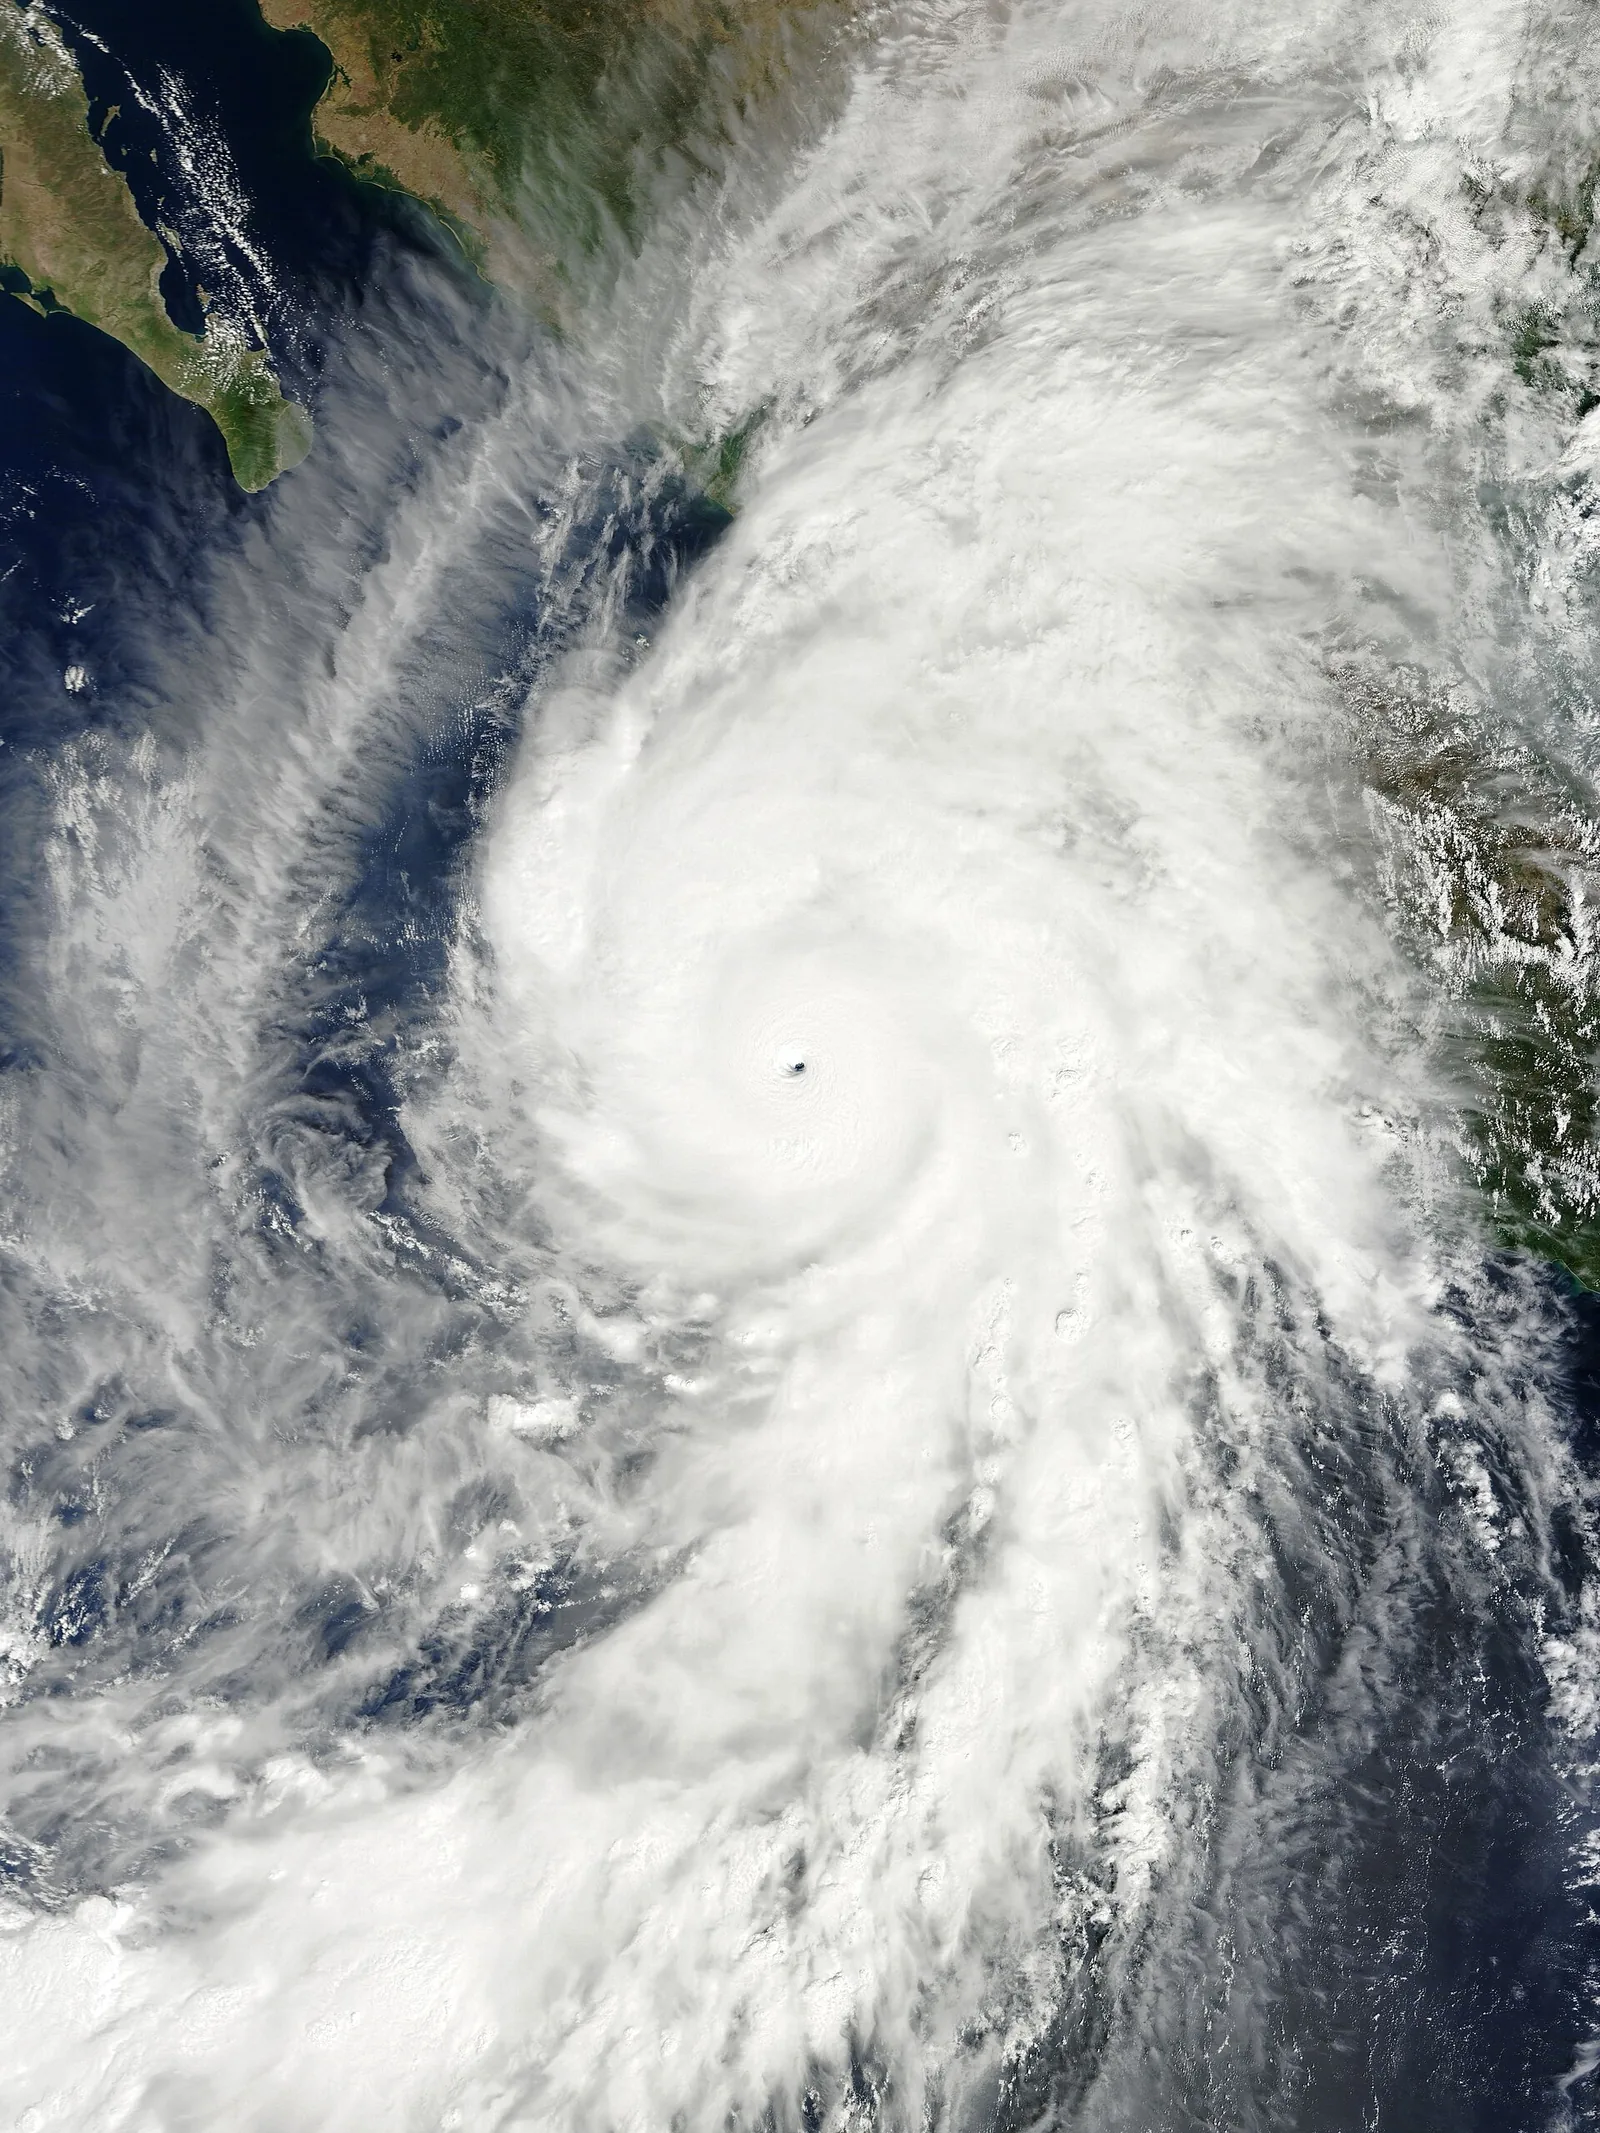
Figure 1: Hurricane Patricia in the East Pacific, October 23, 2015. Reaching the theoretical Dvorak limit of T8.0 with a central pressure of 872 hPa and 1-minute sustained winds of 185 knots (~95 m/s), it remains the strongest tropical cyclone ever recorded in the Western Hemisphere.
I. Conceptual Clarification: Deconstructing the “T8” Misnomer
In formal meteorology, “Hurricane” and “Typhoon” are regional labels for the same phenomenon: the Tropical Cyclone. The distinction is purely geographic, divided by the International Date Line:
- West of the Date Line (Northwest Pacific and South China Sea): These are Typhoons.
- East of the Date Line (East/Central Pacific) and the Atlantic: These are Hurricanes.
The “T8 Hurricane” frequently cited online is a product of two distinct meteorological scales being erroneously conflated:
1. The Dvorak Technique “T8.0” Theoretical Ceiling
The vast reaches of the open ocean lack dense buoy networks and radar coverage. To solve this, Vernon Dvorak developed a method in the 1970s to estimate intensity via infrared and visible satellite imagery.
- The system assigns a “T-number” ranging from T1.0 to T8.0 (in 0.5 increments).
- T8.0 represents the absolute theoretical peak of a storm’s satellite signature: perfect symmetry, extremely cold cloud tops (often below -80°C), a pinhole eye of absolute clarity, and an eyewall as dense as iron.
- Physically, a T8.0 rating corresponds to 1-minute sustained winds of 170 knots (~85 m/s or 306 km/h) and central pressures often dipping below 880 hPa.
Storms officially rated T8.0 are rare: Super Typhoon Haiyan (2013), Super Typhoon Goni (2020), and Hurricane Patricia (2015). When professionals say “T8,” they are describing a perfect satellite score, not a storm category.
2. Hong Kong’s “Signal No. 8” (The T8 Warning)
The Hong Kong Observatory uses a warning system where the “Gale or Storm Signal No. 8” is colloquially abbreviated as “T8.”
- This signal indicates that gale-force winds are occurring or expected near sea level in Hong Kong (sustained winds of 63–117 km/h).
- This is a civil defense signal for urban safety, reflecting local risk. It has zero correlation with the physical intensity of a storm’s core located hundreds of kilometers away.
Confusing these two leads to the sensationalist—and scientifically meaningless—claim of a “T8 Category Hurricane.”
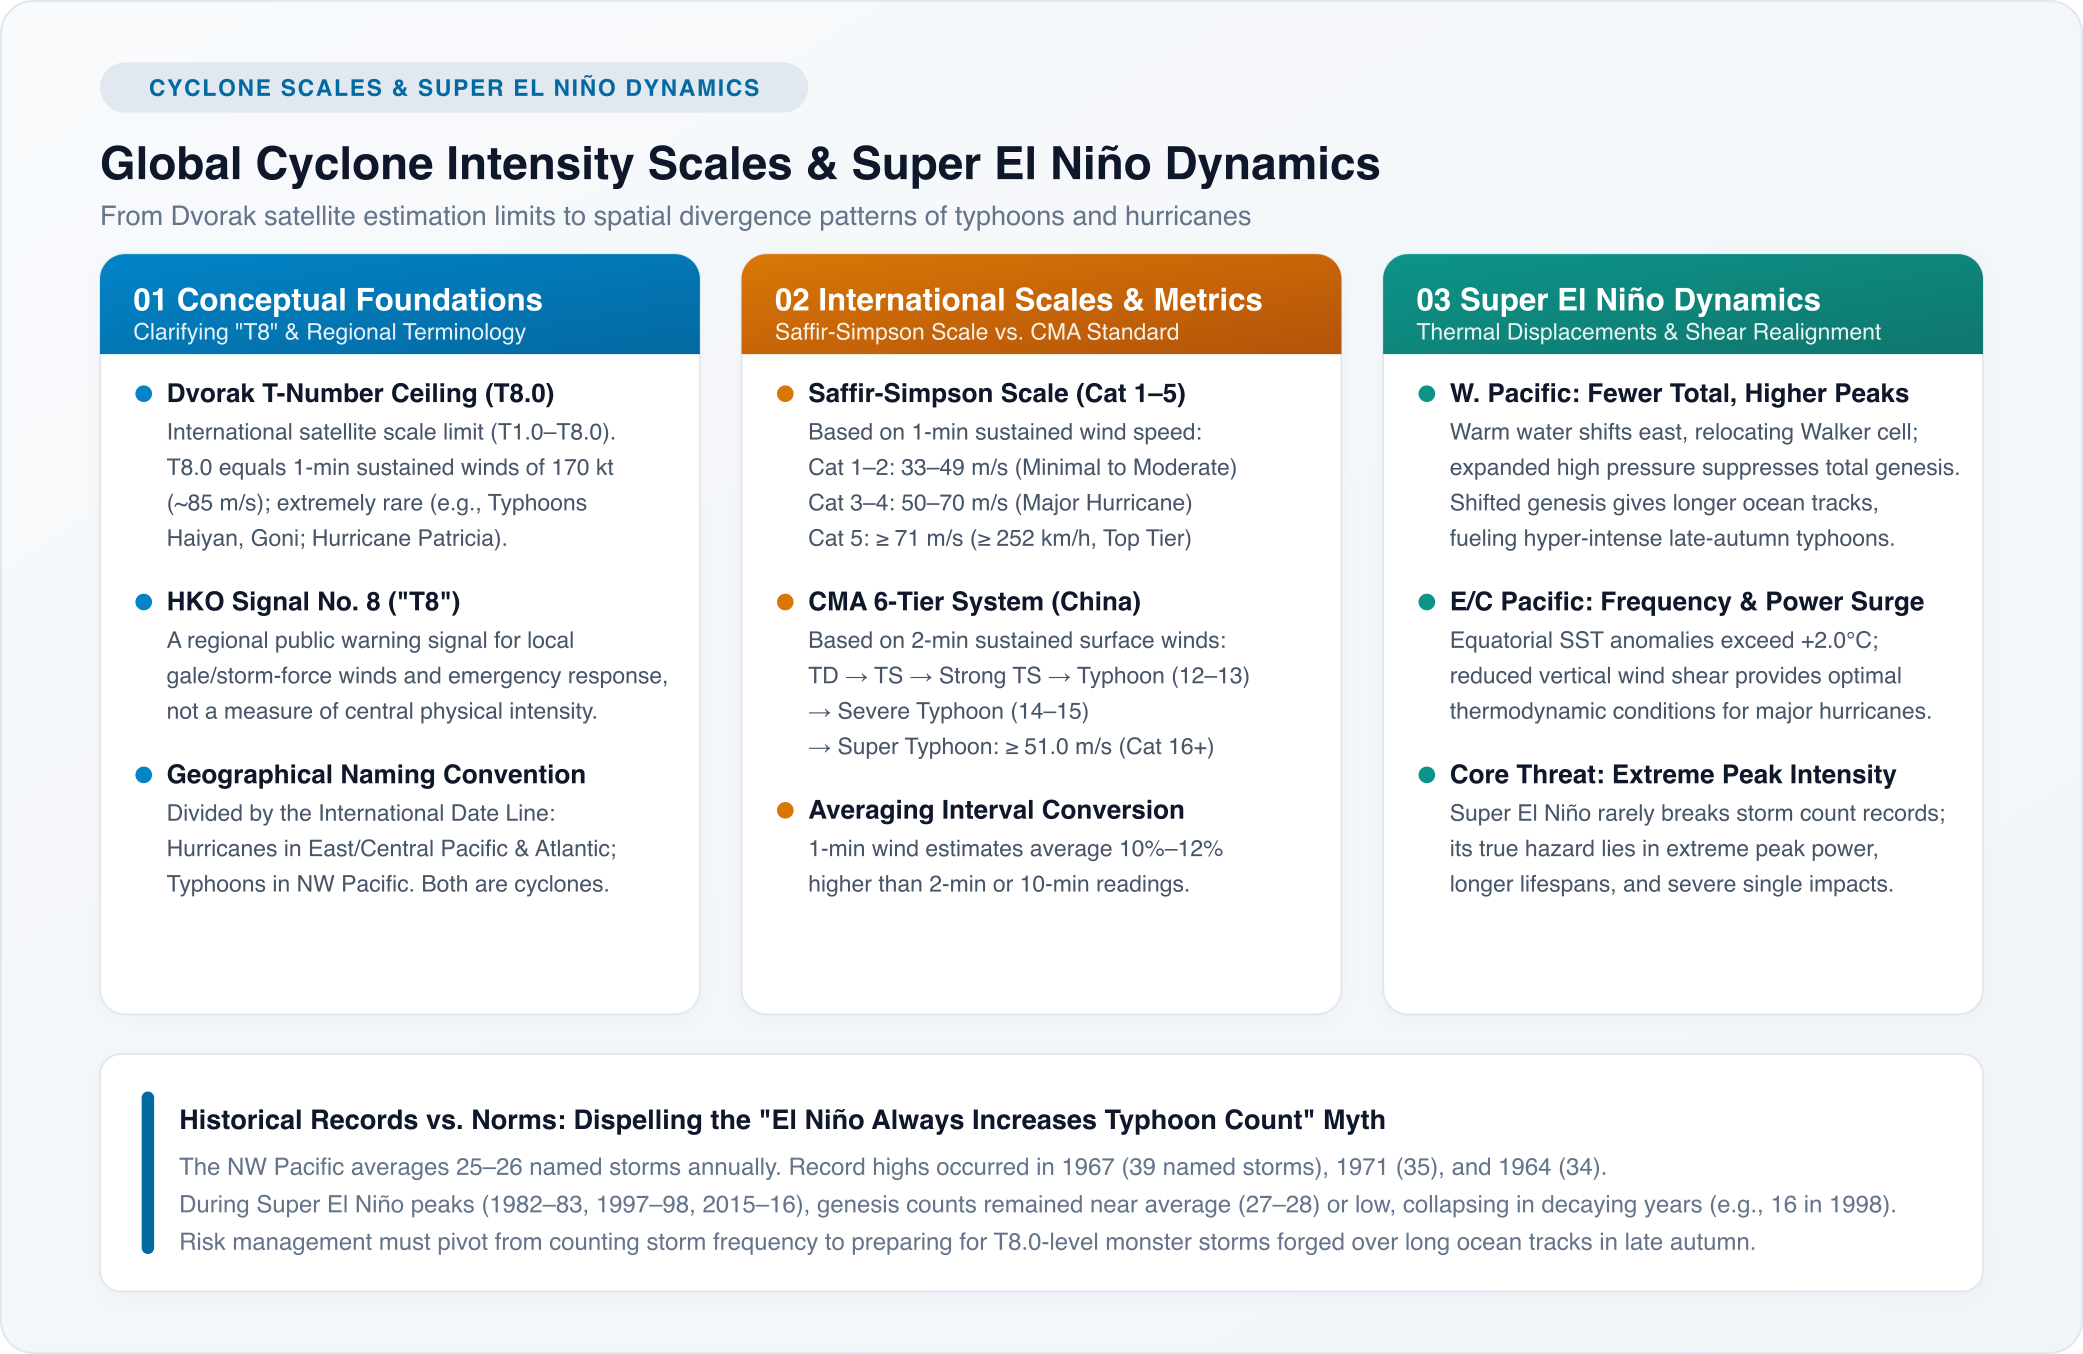
Figure 2: The hierarchy of global intensity scales vs. the spatial energy distribution under Super El Niño conditions.
II. Global Intensity Scales: The Temporal Trap of Wind Sampling
Meteorological agencies categorize cyclones based on “Maximum Sustained Winds” (MSW). However, the sampling duration for these averages varies by region, creating a trap for the uninitiated.
1. The Saffir-Simpson Hurricane Wind Scale
Used by the US National Hurricane Center (NHC) for the Atlantic and Northeast Pacific, utilizing a 1-minute average:
| Category | 1-Min Sustained Wind (m/s) | Speed (km/h) | Typical Impact |
|---|---|---|---|
| Category 1 | 33–42 m/s | 119–153 km/h | Minor damage to unanchored structures, power outages |
| Category 2 | 43–49 m/s | 154–177 km/h | Roof and window damage, shallow-rooted trees uprooted |
| Category 3 (Major) | 50–58 m/s | 178–208 km/h | Structural damage, devastating storm surge, utility failure |
| Category 4 (Major) | 59–70 m/s | 209–251 km/h | Potential wall collapse, coastal inundation, uninhabitable for weeks |
| Category 5 (Highest) | ≥ 71 m/s | ≥ 252 km/h | Catastrophic destruction, total structural failure of most homes |
2. China Meteorological Administration (CMA) Standard
The CMA and most Asian agencies utilize a 2-minute average (closer to the WMO-recommended 10-minute average):
| Classification | Code | 2-Min Sustained Wind (m/s) | Beaufort Scale Equivalent |
|---|---|---|---|
| Tropical Depression | TD | 10.8–17.1 m/s | Force 6–7 |
| Tropical Storm | TS | 17.2–24.4 m/s | Force 8–9 |
| Severe Tropical Storm | STS | 24.5–32.6 m/s | Force 10–11 |
| Typhoon | TY | 32.7–41.4 m/s | Force 12–13 |
| Severe Typhoon | STY | 41.5–50.9 m/s | Force 14–15 |
| Super Typhoon | Super TY | ≥ 51.0 m/s | Force 16+ |
The Conversion Factor: Due to the physics of turbulence, shorter sampling windows yield higher wind speed values. A 1-minute average is typically 10–12% higher than a 2-minute average and 15–20% higher than a 10-minute average. An Atlantic Category 5 hurricane, if measured by CMA 2-minute standards, generally falls into the 55–65 m/s Super Typhoon range.
III. The Super El Niño Engine: Spatial Bifurcation of Oceanic Energy
“Super El Niño” occurs when sea surface temperature (SST) anomalies in the central and eastern equatorial Pacific exceed +2.0°C (or even +2.5°C) for consecutive months. This massive thermal anomaly reshapes global atmospheric circulation, forcing a radical redistribution of energy across the Pacific.
The Kinetic Divergence of Super El Niño
- Northwest Pacific (Typhoon Zone) ➔ Eastward shift of the Walker Circulation ➔ Stronger Subtropical High ➔ Suppressed convection ➔ Fewer total typhoons, but individual storms are more energetic due to eastward genesis.
- East/Central Pacific (Hurricane Zone) ➔ Direct alignment with warm water ➔ Plummeting vertical wind shear ➔ Thermodynamic and dynamic synergy ➔ Surge in both frequency and the ratio of major hurricanes.
1. Northwest Pacific: Quality Over Quantity
Counter-intuitively, warmer water does not always mean more typhoons. In Super El Niño years, the total count in the West Pacific often stays average or even drops.
- Convective Suppression: As the rising limb of the Walker Circulation moves east, the West Pacific experiences anomalous sinking air. The Subtropical High expands, suppressing the “incubation” of tropical disturbances.
- Deep-Sea Genesis: The warm pool expansion forces typhoons to form much further east and south (near the Marshall Islands).
- The “Battery” Effect: Forming further from the Asian landmass means these cyclones must travel thousands of kilometers over 29°C–30°C waters. This long transit allows for massive latent heat accumulation. If wind shear remains low, these “late-season” storms can explode into T8.0-level monsters with pressures below 900 hPa.
2. East/Central Pacific: The Energy Carnival
The East Pacific becomes the primary theater for thermal release. Waters usually cooled by the Peru Current and upwelling become unnaturally warm. Vertical wind shear—the “typhoon killer”—vanishes. In 2015, Hurricane Patricia utilized this environment to undergo “Rapid Intensification” (RI), dropping 100 hPa in 24 hours, a feat of atmospheric violence rarely seen in history.
IV. Historical Context: Is This the “Most Active” Year?
The data suggests a definitive no.
Historical records show a significant non-linear decoupling between the number of storms and the intensity of individual events.
1. The Records of Frequency
In the Northwest Pacific:
- The All-Time Peak occurred in 1967: 39 named storms (JTWC recorded 40).
- Runners-up: 1971 (35 storms) and 1964 (34 storms).
- The Baseline: The annual average remains steady at 25–26 storms.
These high-frequency years are rarely El Niño years; they are typically years of extreme monsoon trough activity and dense tropical waves.
2. The El Niño Statistical Reality
Looking at the three major Super El Niño events of the last half-century:
- 1982–1983: 1982 saw 25 typhoons (average); 1983 saw only 23.
- 1997–1998: 1997 saw 28 (slightly above average); 1998 saw a collapse to 16 storms, one of the quietest years on record.
- 2015–2016: 2015 saw 27; 2016 saw 26.
The rule is clear: Super El Niño is not a volume booster for typhoons; it is a volatility amplifier.
V. Strategic Convergence: From Counting Storms to Defending Against Extremes
In light of the technical realities of “T8 Hurricanes” and “Super El Niño,” risk management—both for individuals and infrastructure—requires three cognitive shifts:
- Linguistic Discipline: There is no “T8 Hurricane.” Dvorak’s T8.0 is a measure of peak morphology; Hong Kong’s T8 is a local safety signal. Conflating them creates false panic and obscures real risk.
- Beware the Late-Season Extremes: Do not be lulled into complacency by a “quiet” year. Storms born in the deep Pacific during El Niño cycles possess higher energy density and a greater propensity for rapid intensification.
- Engineering for Tail Risks: Extreme weather is shifting toward low-frequency, high-magnitude pulses. Coastal infrastructure and asset protection must move away from “average-based” planning and calibrate toward the true physical limits of the atmosphere.
Related Research & Topics
Tello Mobile eSIM
SafetyWing Nomad Insurance
* Disclosure: This post contains affiliate links. If you make a purchase through these links, V-G Journal may earn a small commission at no additional cost to you. We only recommend services we independently evaluate and trust.
FIRE and Golf:自由旅居之路
专注于为追求 FIRE 与品质生活的人群提供特惠打球权益与候鸟微度假。不持一砖一瓦,运营品质生活。